

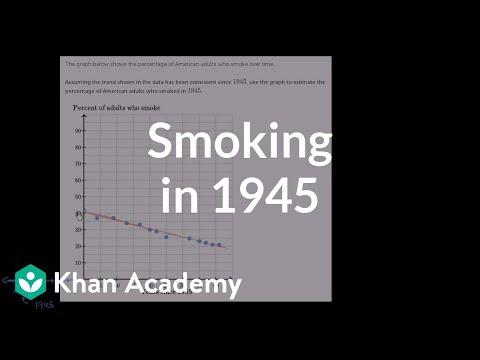
Plot and sketch a line
How to do it:
1. Note direction (positive or negative association), clusters, and outliers. See Scatter Plots & Bivariate Data.
2. Draw a straight line that balances points above and below.
3. Follow the cloud; do not chase every outlier. Check the sketch in the Graphing Calculator or Function Lab.
Worked example: Walk-a-thon pairs (miles, dollars pledged) slope upward. A balancing line through the cloud is the model, not a connect-the-dots path.
Check: one outlier (a -hour shift with a huge pledge) can yank a hand-drawn line. Investigate before you let it dominate.